DIA-NN

A leading software suite for
LC-MS proteomics

Instant biological insights

Integrated statistics and visualisation, from gene sets to individual signals.

Adopted across life sciences

Powering pharma, biotech, CRO and academic labs worldwide.

4000+ citations

For the core DIA-NN algorithm paper in Nature Methods.

Google Scholar · September 2026

Applications

Depth and accuracy across proteomics experiments

Sensitive identification, reliable quantities and explicit confidence measures across proteomics applications.

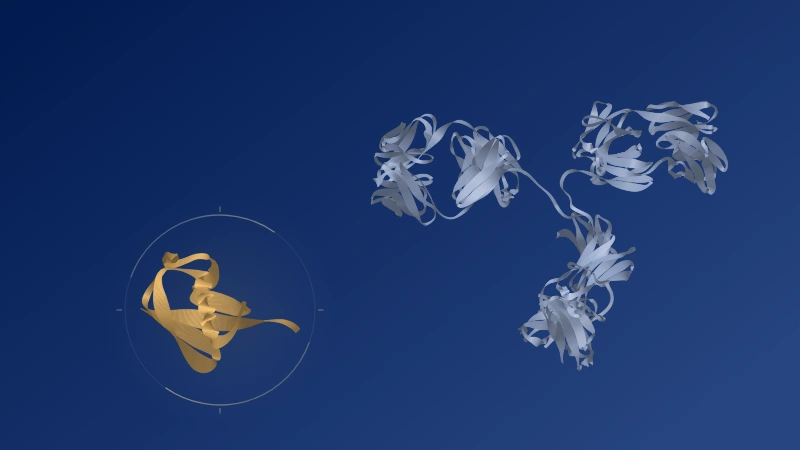
DIA-NN across the breadth of proteomics dataConceptual atlas of kinds of proteomics data analysed by DIA-NN, arranged around the DIA-NN engine, which delivers deep identification, accurate quantities and confidence measures. A grid of runs represents large cohorts, including some missing values; 500 SPD denotes an example acquisition throughput of 500 samples per day. One long dense profile represents long-gradient, ultra-deep analysis. Eight small grids of microdroplets are arranged in two rows on a large, thin glass slide, representing low-input samples down to single cells. One highlighted droplet is connected to a magnified schematic cell above the slide, with a membrane, nucleus and internal structures. An MS1 survey spectrum with selected precursors represents label-free data-dependent acquisition. Three identical isotope envelopes with Δ0, Δ4 and Δ8 mass-offset labels represent plexDIA multiplexing. Fragment ions shifted by +79.97, the mass of phosphorylation, represent PTM-enriched samples such as phosphoproteomics and K-GG ubiquitinomics. Four schematic HLA class I nine-residue peptides with highlighted P2/P9 anchor pairs H–L, Y–E, A–F and R–Y represent immunopeptidomics with non-specific digests. A schematic antibody beside two smaller highlighted globular proteins with compact helices, sheets and connecting loops represents host cell protein (HCP) analysis in biotherapeutics. In every panel, the signal of interest is highlighted. All graphics are authored illustrations, not measured data or molecular structures; no common scale, identification count, data completeness or relative performance is implied. DIA-NNLarge cohortsLong gradientsLow inputSingle cellsDDAMultiplexedPTMsImmunopeptidomicsHCPDIA-NN across the breadth of proteomics dataConceptual atlas of kinds of proteomics data analysed by DIA-NN, arranged around the DIA-NN engine, which delivers deep identification, accurate quantities and confidence measures. A grid of runs represents large cohorts, including some missing values; 500 SPD denotes an example acquisition throughput of 500 samples per day. One long dense profile represents long-gradient, ultra-deep analysis. Eight small grids of microdroplets are arranged in two rows on a large, thin glass slide, representing low-input samples down to single cells. One highlighted droplet is connected to a magnified schematic cell above the slide, with a membrane, nucleus and internal structures. An MS1 survey spectrum with selected precursors represents label-free data-dependent acquisition. Three identical isotope envelopes with Δ0, Δ4 and Δ8 mass-offset labels represent plexDIA multiplexing. Fragment ions shifted by +79.97, the mass of phosphorylation, represent PTM-enriched samples such as phosphoproteomics and K-GG ubiquitinomics. Four schematic HLA class I nine-residue peptides with highlighted P2/P9 anchor pairs H–L, Y–E, A–F and R–Y represent immunopeptidomics with non-specific digests. A schematic antibody beside two smaller highlighted globular proteins with compact helices, sheets and connecting loops represents host cell protein (HCP) analysis in biotherapeutics. In every panel, the signal of interest is highlighted. All graphics are authored illustrations, not measured data or molecular structures; no common scale, identification count, data completeness or relative performance is implied. DIA-NNLarge cohortsLong gradientsLow inputSingle cellsDDAMultiplexedPTMsImmunopeptidomicsHCP

QuantUMS quantification

Accurate quantification with quality scores

QuantUMS uses machine learning to adapt quantification to the specific experiment. It improves precision, reduces ratio compression and estimates the quality of individual quantities, supporting reliable biological analysis.

QuantUMS quantification and qualityConceptual diagram of MS1 and MS2 evidence entering the dataset-adapted QuantUMS method. Relative quantities and quantitative quality measures are separate outputs. Signal intensities, bar lengths and quality-marker positions are illustrative, with no experimental scale or performance claim. MS1 + MS2 evidenceLearned weightingQuantities and quality MS1Isotope seriesMS2Fragment ionsQuantUMSDataset-adaptedQuantityQuality score

PTMs and peptidoforms

Confidence in modified peptides

DIA-NN addresses the long-standing challenge of DIA proteomics, enabling DDA-like confidence in peptidoform assignment. It further localises and quantifies individual PTM sites.

Peptidoform confidence and PTM localisationConceptual peptide schematic. Peptidoform confidence concerns the sequence and its set of modifications. Site localisation separately concerns which residue carries a modification. One phosphate is depicted at a serine, with two other possible serine or threonine sites marked as alternatives. No numerical confidence value is represented. SITE LOCALISATION phosphoS6Candidate sitesS4, T51V2D3A4S5T6S7P8E9G10L11K Peptidoform confidenceSequence + modification set

Large search spaces

InfinDIA: fast searches of vast peptide spaces

Search very large peptide candidate spaces at exceptional speed. InfinDIA enables workflows such as full-length non-specific digest searches for immunopeptidomics, metaproteomics or large-scale PTM discovery.

InfinDIA for large peptide search spacesConceptual illustration of peptide queries against the special InfinDIA data representation. Selected candidate peptides proceed to the regular DIA-NN search. Highlighted example sequences reappear in the candidate selection; they do not represent final identifications. The illustrative sequence field and three displayed examples represent neither a library size nor a candidate count. The fine organised field is a visual abstraction, not a literal description of the internal representation or a speed measurement. Example applications include non-specific digests and immunopeptidomics. Peptide queriesVLSPADKTVDLEELKASFAAGLQFPVYEAPQLLKTYASVQTMKDLGTIPNLESAKLVEDAGHFTPGASQYVLNQELVFKDAWGLSTAPYIFDEVKQLATVMQGTPESLLGTPEVQAFDVNQSKLPAELPAGWTSVQYLVKDNASAPFQTLGVESVEKPLNAFMGTLSDQAVYAPQNVKLEKDLVETGSATQALFVPENNGLKQSTAVEPVADYTLQPQLATVGESGVEASLQNFLQPTDAVKEAVKELTQGSFSNQLPAVEGILGFVFTLQEGVPTLNAVLDQSKAPEAEPTVLQNSNKVQALDGTDFGQVELAPSVLPAKQTEEVQTLKADGLAPVNQTESADQELVTKPGTPQNLAVEQVKADLSETVLENQTGPATGLAPVQKEQPSVNALETAVEGQTLKPKLSEYQAVPKTLQESVAPVQGELNATP Non-specific digests ImmunopeptidomicsInfinDIAINDEXCandidates AAGLQFPVY GILGFVFTL KLSEYQAVPDIA-NN search

Data-dependent acquisition

Deep DDA proteomics with quantitative control

For DDA workflows, DIA-NN combines deep identification with MS1-level quality metrics that control quantitative accuracy.

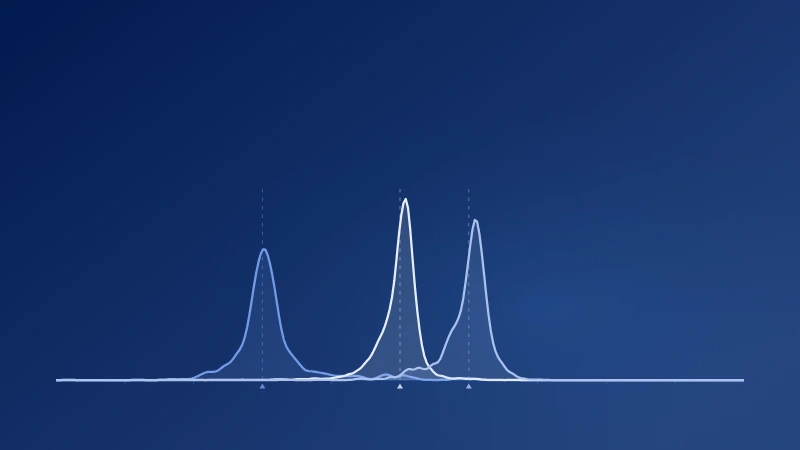
DDA quantitative accuracy after MS1-level quality filteringMeasured precursor log2 ratio distributions from the ProteoBench DDA benchmark, analysed with DIA-NN 2.6 after MS1-level quality filtering. Dashed lines mark expected ratios: human zero, yeast one, E. coli minus two. Full experimental conditions and filters are available in the linked application note. ProteoBench DDAE. coli · 1:4Human · 1:1Yeast · 2:1MS1 QUALITY FILTERINGAccurate DDA quantification−4−2024Precursor abundance ratio · log₂(A:B)Density A:B = mixture A / mixture B · dashed lines: expected ratios

From a workstation to large-scale infrastructure

Interactive analysis and automation

Configure in several mouse clicks and analyse interactively on a PC. Or run automated pipelines on workstations, clusters and cloud infrastructure.

Easy configuration, convenient pipelines and effortless automation.DIA-NN Wizard detail: choose modifications with a click, including oxidation and phosphorylation, or search UniMod. The full pipeline interface shows predicted-library generation followed by protein quantification, with an illustrative 2500 input files, native editing controls and the Execute Pipeline button. Automation is available on workstations, cloud infrastructure and clusters, using the DIA-NN interface and pipeline files. Vector interface details are adapted from the product; connections and infrastructure symbols are explanatory. No analysis results are shown. Configure in a few clicksWizardSearch UniMod (e.g. Phospho, Acetyl, oxidation…)Arrange analyses in pipelinesProtein quantificationAutomateEasy configuration, convenient pipelines and effortless automation.DIA-NN Wizard detail: choose modifications with a click, including oxidation and phosphorylation, or search UniMod. The full pipeline interface shows predicted-library generation followed by protein quantification, with an illustrative 2500 input files, native editing controls and the Execute Pipeline button. Automation is available on workstations, cloud infrastructure and clusters, using the DIA-NN interface and pipeline files. Vector interface details are adapted from the product; connections and infrastructure symbols are explanatory. No analysis results are shown. Configure in a few clicksWizardSearch UniMod (e.g. Phospho, Acetyl, oxidation…)Arrange analyses in pipelinesProtein quantificationAutomateEasy configuration, convenient pipelines and effortless automation.DIA-NN Wizard detail: choose modifications with a click, including oxidation and phosphorylation, or search UniMod. The full pipeline interface shows predicted-library generation followed by protein quantification, with an illustrative 2500 input files, native editing controls and the Execute Pipeline button. Automation is available on workstations, cloud infrastructure and clusters, using the DIA-NN interface and pipeline files. Vector interface details are adapted from the product; connections and infrastructure symbols are explanatory. No analysis results are shown. Configure in a few clicksWizardSearch UniMod (e.g. Phospho, Acetyl, oxidation…)Arrange analyses in pipelinesProtein quantificationAutomate

Biological interpretation

Follow your results into the biology

Analyse at every level — from pathway enrichment to protein regulation, precursor coverage and individual fragment-ion signals.

  1. 01

    Test pathways

    PathwaysSchematic pathway groups and a selected pathway. Connections and node colours are illustrative, not an inferred biological network or a statistical result. Selected pathway

    Find coordinated changes across biological processes.

  2. 02

    Inspect proteins

    ProteinsIllustrative regulation patterns across proteins within a pathway. One protein row is selected for deeper examination. The colours are schematic; no experimental matrix or significance value is claimed. Selected protein

    Explore how proteins within a pathway are regulated.

  3. 03

    Map precursors

    PrecursorsSchematic precursor regions aligned to their positions along a protein sequence. Colours distinguish illustrative regulation patterns. One precursor region is selected. No protein identity, residue numbers or measured coverage is represented. Selected precursor

    Examine regulation along the protein sequence.

  4. 04

    Examine signals

    Fragment ionsIllustrative fragment-ion chromatograms from one precursor. The traces share an asymmetric elution profile, with differing signal amplitudes and small sampling fluctuations. They convey coelution, not measured retention times or experimental intensities.

    Trace a precursor back to its fragment-ion chromatograms.

Science

Extensive scientific basis

Six peer-reviewed papers describe the algorithms that underpin DIA-NN Enterprise.

1

Nature Methods

2

Nature Communications

From Aptila

Latest developments

All news

DIA-NN Enterprise

Unlocking the true potential of proteomics

Licences are available for industry and academic institutions.